Tag Archives: hard drive

RAID Levels 03 and 30

RAID Levels 0+3 (03 or 53) and 3+0 (30)

Common Name(s): The most confusing naming of any of the RAID levels. :^) In an ideal world, this level would be named RAID 0+3 (or 03) or RAID 3+0 (30). Instead, the number 53 is often used in place of 03 for reasons I have never been able to determine, and worse, 53 is often actually implemented as 30, not 03. As always, verify the details of the implementation to be sure of what you have.

Technique(s) Used: Byte striping with dedicated parity combined with block striping.

Description: RAID 03 and 30 (though often called 53 for a reason that utterly escapes me) combine byte striping, parity and block striping to create large arrays that are conceptually difficult to understand. :^) RAID 03 is formed by putting into a RAID 3 array a number of striped RAID 0 arrays; RAID 30 is more common and is formed by striping across a number of RAID 3 sub-arrays. The combination of parity, small-block striping and large-block striping makes analyzing the theoretical performance of this level difficult. In general, it provides performance better than RAID 3 due to the addition of RAID 0 striping, but closer to RAID 3 than RAID 0 in overall speed, especially on writes. RAID 30 provides better fault tolerance and rebuild performance than RAID 03, but both depend on the “width” of the RAID 3 dimension of the drive relative to the RAID 0 dimension: the more parity drives, the lower capacity and storage efficiency, but the greater the fault tolerance. See the examples below for more explanation of this.

Most of the characteristics of RAID 0+3 and 3+0 are similar to those of RAID 0+5 and 5+0. RAID 30 and 03 tend to be better for large files than RAID 50 and 05.

Controller Requirements: Generally requires a high-end hardware controller.

Hard Disk Requirements: Number of drives must be able to be factored into two integers, one of which must be 2 or higher and the other 3 or higher (you can make a RAID 30 array from 10 drives but not 11). Minimum number of drives is six, with the maximum set by the controller.

Array Capacity: For RAID 03: (Size of Smallest Drive) * (Number of Drives In Each RAID 0 Set) * (Number of RAID 0 Sets – 1). For RAID 30: (Size of Smallest Drive) * (Number of Drives In Each RAID 3 Set – 1) * (Number of RAID 3 Sets).

For example, the capacity of a RAID 03 array made of 15 18 GB drives arranged as three five-drive RAID 0 sets would be 18 GB * 5 * (3-1) = 180 GB. The capacity of a RAID 30 array made of 21 18 GB drives arranged as three seven-drive RAID 3 sets would be 18 GB * (7-1) * 3 = 324 GB. The same 21 drives arranged as seven three-drive RAID 3 sets would have a capacity of 18 GB * (3-1) * 7 = “only” 252 GB.

Storage Efficiency: For RAID 03: ( (Number of RAID 0 Sets – 1) / Number of RAID 0 Sets). For RAID 30: ( (Number of Drives In Each RAID 3 Set – 1) / Number of Drives In Each RAID 3 Set).

Taking the same examples as above, the 15-drive RAID 03 array would have a storage efficiency of (3-1)/3 = 67%. The first RAID 30 array, configured as three seven-drive RAID 3 sets, would have a storage efficiency of (7-1)/7 = 86%, while the other RAID 30 array would have a storage efficiency of, again, (3-1)/3 = 67%.

Fault Tolerance: Good to very good, depending on whether it is RAID 03 or 30, and the number of parity drives relative to the total number. RAID 30 will provide better fault tolerance than RAID 03.

Consider the two different 21-drive RAID 30 arrays mentioned above: the first one (three seven-drive RAID 3 sets) has higher capacity and storage efficiency, but can only tolerate three maximum potential drive failures; the one with lower capacity and storage efficiency (seven three-drive RAID 3 sets) can handle as many as seven , if they are in different RAID 3 sets. Of course few applications really require tolerance for seven independent drive failures! And of course, if those 21 drives were in a RAID 03 array instead, failure of a second drive after one had failed and taken down one of the RAID 0 sub-arrays would crash the entire array.

Availability: Very good to excellent.

Degradation and Rebuilding: Relatively little for RAID 30 (though more than RAID 10); can be more substantial for RAID 03.

Random Read Performance: Very good, assuming RAID 0 stripe size is reasonably large.

Random Write Performance: Fair.

Sequential Read Performance: Very good to excellent.

Sequential Write Performance: Good.

Cost: Relatively high due to requirements for a hardware controller and a large number of drives; storage efficiency is better than RAID 10 however and no worse than any other RAID levels that include redundancy.

Special Considerations: Complex and expensive to implement.

Recommended Uses: Not as widely used as many other RAID levels. Applications include data that requires the speed of RAID 0 with fault tolerance and high capacity, such as critical multimedia data and large database or file servers. Sometimes used instead of RAID 3 to increase capacity as well as performance.


The PC Guide
Site Version: 2.2.0 – Version Date: April 17, 2001
© Copyright 1997-2004 Charles M. Kozierok. All Rights Reserved.

This is an archive of Charles M. Kozierok’s PCGuide (pcguide.com) which disappeared from the internet in 2018. We wanted to preserve Charles M. Kozierok’s knowledge about computers and are permanently hosting a selection of important pages from PCGuide.

RAID Levels 01 and 10

RAID Levels 0+1 (01) and 1+0 (10)

Common Name(s): RAID 0+1, 01, 0/1, “mirrored stripes”, “mirror of stripes”; RAID 1+0, 10, 1/0, “striped mirrors”, “stripe of mirrors”. Labels are often used incorrectly; verify the details of the implementation if the distinction between 0+1 and 1+0 is important to you.

Technique(s) Used: Mirroring and striping without parity.

Description: The most popular of the multiple RAID levels, RAID 01 and 10 combine the best features of striping and mirroring to yield large arrays with high performance in most uses and superior fault tolerance. RAID 01 is a mirrored configuration of two striped sets; RAID 10 is a stripe across a number of mirrored sets. RAID 10 and 01 have been increasing dramatically in popularity as hard disks become cheaper and the four-drive minimum is legitimately seen as much less of an obstacle. RAID 10 provides better fault tolerance and rebuild performance than RAID 01. Both array types provide very good to excellent overall performance by combining the speed of RAID 0 with the redundancy of RAID 1 without requiring parity calculations.

RAID Levels 01 and 10

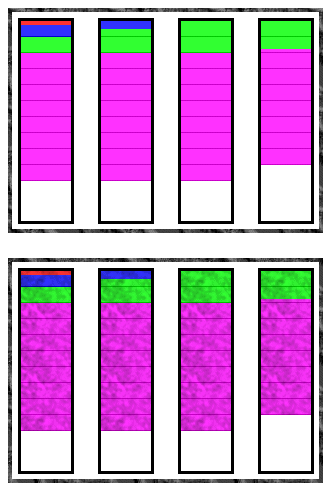
This illustration shows how files of different sizes are distributed between the drives on an eight-disk RAID 0+1 array using a 16 kiB stripe size for the RAID 0 portion. As with the RAID 0 illustration, the red file is 4 kiB in size; the blue is 20 kiB; the green is 100 kiB; and the magenta is 500 kiB, with each vertical pixel representing 1 kiB of space. The large, patterned rectangles represent the two RAID 0 “sub arrays”, which are mirrored using RAID 1 to create RAID 0+1.
The contents of the striped sets are thus identical. The diagram for RAID 1+0
would be the same except for the groupings: instead of two large boxes dividing the drives horizontally, there would be four large boxes dividing the drives vertically into mirrored pairs. These pairs would then be striped together to form level 1+0. Contrast this diagram to the ones for RAID 0 and RAID 1.

Controller Requirements: Almost all hardware controllers will support one or the other of RAID 10 or RAID 01, but often not both. Even low-end cards will support this multiple level, usually RAID 01. High-end cards may support both 01 and 10.

Hard Disk Requirements: An even number of hard disks with a minimum of four; maximum dependent on controller. All drives should be identical.

Array Capacity: (Size of Smallest Drive) * (Number of Drives ) / 2.

Storage Efficiency: If all drives are the same size, 50%.

Fault Tolerance: Very good for RAID 01; excellent for RAID 10.

Availability: Very good for RAID 01; excellent for RAID 10.

Degradation and Rebuilding: Relatively little for RAID 10; can be more substantial for RAID 01.

Random Read Performance: Very good to excellent.

Random Write Performance: Good to very good.

Sequential Read Performance: Very good to excellent.

Sequential Write Performance: Good to very good.

Cost: Relatively high due to large number of drives required and low storage efficiency (50%).

Special Considerations: Low storage efficiency limits potential array capacity.

Recommended Uses: Applications requiring both high performance and reliability and willing to sacrifice capacity to get them. This includes enterprise servers, moderate-sized database systems and the like at the high end, but also individuals using larger IDE/ATA hard disks on the low end. Often used in place of RAID 1 or RAID 5 by those requiring higher performance; may be used instead of RAID 1 for applications requiring more capacity.


The PC Guide
Site Version: 2.2.0 – Version Date: April 17, 2001
© Copyright 1997-2004 Charles M. Kozierok. All Rights Reserved.

This is an archive of Charles M. Kozierok’s PCGuide (pcguide.com) which disappeared from the internet in 2018. We wanted to preserve Charles M. Kozierok’s knowledge about computers and are permanently hosting a selection of important pages from PCGuide.
RAID Levels Comparison

Summary Comparison of RAID Levels

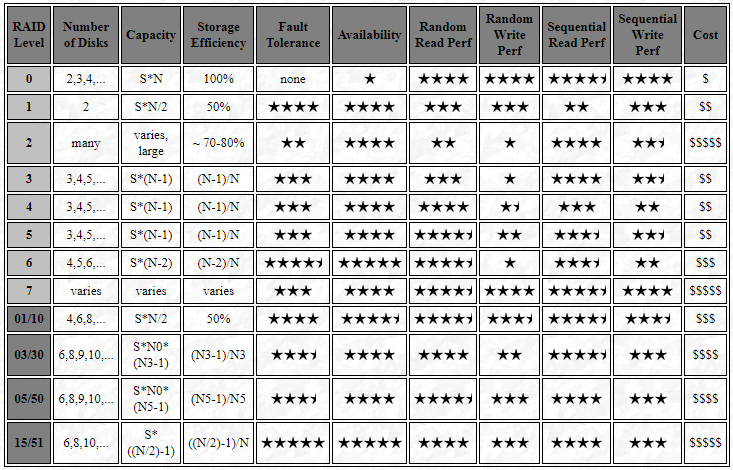
Below you will find a table that summarizes the key quantitative attributes of the various RAID levels for easy comparison. For the full details on any RAID level, see its own page, accessible here. For a description of the different characteristics, see the discussion of factors differentiating RAID levels. Also be sure to read the notes that follow the table:

Comparison of all RAID Levels

Notes on the table:

  • For the number of disks, the first few valid sizes are shown; you can figure out the rest from the examples given in most cases. Minimum size is the first number shown; maximum size is normally dictated by the controller. RAID 01/10 and RAID 15/51 must have an even number of drives, minimum 6. RAID 03/30 and 05/50 can only have sizes that are a product of integers, minimum 6.
  • For capacity and storage efficiency, “S” is the size of the smallest drive in the array, and “N” is the number of drives in the array. For the RAID 03 and 30, “N0” is the width of the RAID 0 dimension of the array, and “N3” is the width of the RAID 3 dimension. So a 12-disk RAID 30 array made by creating three 4-disk RAID 3 arrays and then striping them would have N3=4 and N0=3. The same applies for “N5” in the RAID 05/50 row.
  • Storage efficiency assumes all drives are of identical size. If this is not the case, the universal computation (array capacity divided by the sum of all drive sizes) must be used.
  • Performance rankings are approximations and to some extent, reflect my personal opinions. Please don’t over-emphasize a “half-star” difference between two scores!
  • Cost is relative and approximate, of course. In the real world it will depend on many factors; the dollar signs are just intended to provide some perspective.

The PC Guide
Site Version: 2.2.0 – Version Date: April 17, 2001
© Copyright 1997-2004 Charles M. Kozierok. All Rights Reserved.

This is an archive of Charles M. Kozierok’s PCGuide (pcguide.com) which disappeared from the internet in 2018. We wanted to preserve Charles M. Kozierok’s knowledge about computers and are permanently hosting a selection of important pages from PCGuide.

Access Time

One of the most commonly quoted performance statistics for CD-ROM drives is access time. As with most commonly-used performance metric, it is abused at least as much as it is used properly. Curiously, access time is used extensively in quoting the specs of CD-ROM drives, but is virtually never mentioned with respect to hard disks. With hard drives it is much more common to see quotes of the other metrics that are combined to make up access time. (This despite how similarly the devices access data…).

Access time is meant to represent the amount of time it takes from the start of a random read operation until the data starts to be read from the disk. It is a composite metric, really being composed of the following other metrics:

  • Speed Change Time: For CLV drives, the time for the spindle motor to change to the correct speed.
  • Seek Time: The time for the drive to move the heads to the right location on the disk.
  • Latency: The amount of time for the disk to turn so that the right information spins under the read head.

Although access time is made up of the time for these separate operations, this doesn’t mean that you can simply add these other measurements together to get access time. The relationship is more complex than this because some of these items can happen in parallel. For example, there is no reason that the speed of the spindle motor couldn’t be varied at the same time that the heads are moved (and in fact this is done).

The access time of CD-ROM drives in general depends on the rated “X” speed of the drive, although this can and does vary widely from drive to drive. The oldest 1X drives generally had truly abysmal access times, often exceeding 300 ms; as drives have become faster and faster, access times have dropped, and now are below 100 ms on the top-end drives.

Note that while faster “X” rated drives have lower access times, this is due to improvements that reduce the three metrics listed above that contribute to access time. Some of it (latency for example) is reduced when you spin the disk at 8X instead of 1X. On the other hand, seek time improvement is independent of the spin speed of the disk, which is why some 8X drives will have much better access time performance than other 8X drives, for example.

Even the fastest CD-ROM drives are significantly slower than even the slowest hard disks; access time on a high-end CD-ROM is still going to be four or five times higher than that of a high-end disk drive. This is just the nature of the device; CD-ROM drives are based on technology originally developed for playing audio CDs, where random seek performance is very unimportant. CDs do not have cylinders like a hard disk platter, but rather a long continuous spiral of bits, which makes finding specific pieces of data much more difficult.

Even though access time is important in some ways, its importance is generally vastly overstated by the people that sell CD-ROM drives. Random access performance is one component of overall CD-ROM performance, and how essential it is depends on what you are doing with your drive. However even if high random access performance is important, you must bear in mind that there are far fewer random reads done, in general, to a CD than to a hard disk.

Another point is that manufacturers are not always consistent in how they define their averages. Some companies may use different testing methods, and some may even exaggerate in order to make their drives look much better than they actually are. A small difference in quoted access time is not usually going to make any noticeable real-world difference. For most purposes, a drive with a 100 ms access time is going to behave the same as one with a 110 ms access time. It’s usually better at that point to differentiate them based on other performance characteristics or features (or price).


The PC Guide
Site Version: 2.2.0 – Version Date: April 17, 2001
© Copyright 1997-2004 Charles M. Kozierok. All Rights Reserved.

This is an archive of Charles M. Kozierok’s PCGuide (pcguide.com) which disappeared from the internet in 2018. We wanted to preserve Charles M. Kozierok’s knowledge about computers and are permanently hosting a selection of important pages from PCGuide.